Apache Kafka is an open-source distributed event streaming platform that underpins many of today’s real-time data pipelines. As organizations scale their Kafka deployments to support mission-critical use cases, effective Kafka monitoring becomes essential. Monitoring Kafka clusters ensures system reliability, minimizes downtime, and keeps Kafka performance aligned with SLAs.
In this guide, we explore the top 5 Kafka monitoring tools for 2025, covering open-source solutions and advanced enterprise dashboards. Whether you’re running a Kubernetes-native deployment or using Confluent Kafka, robust monitoring is key to tracking broker health, consumer lag, partition distribution, and more.
Why Kafka monitoring is critical
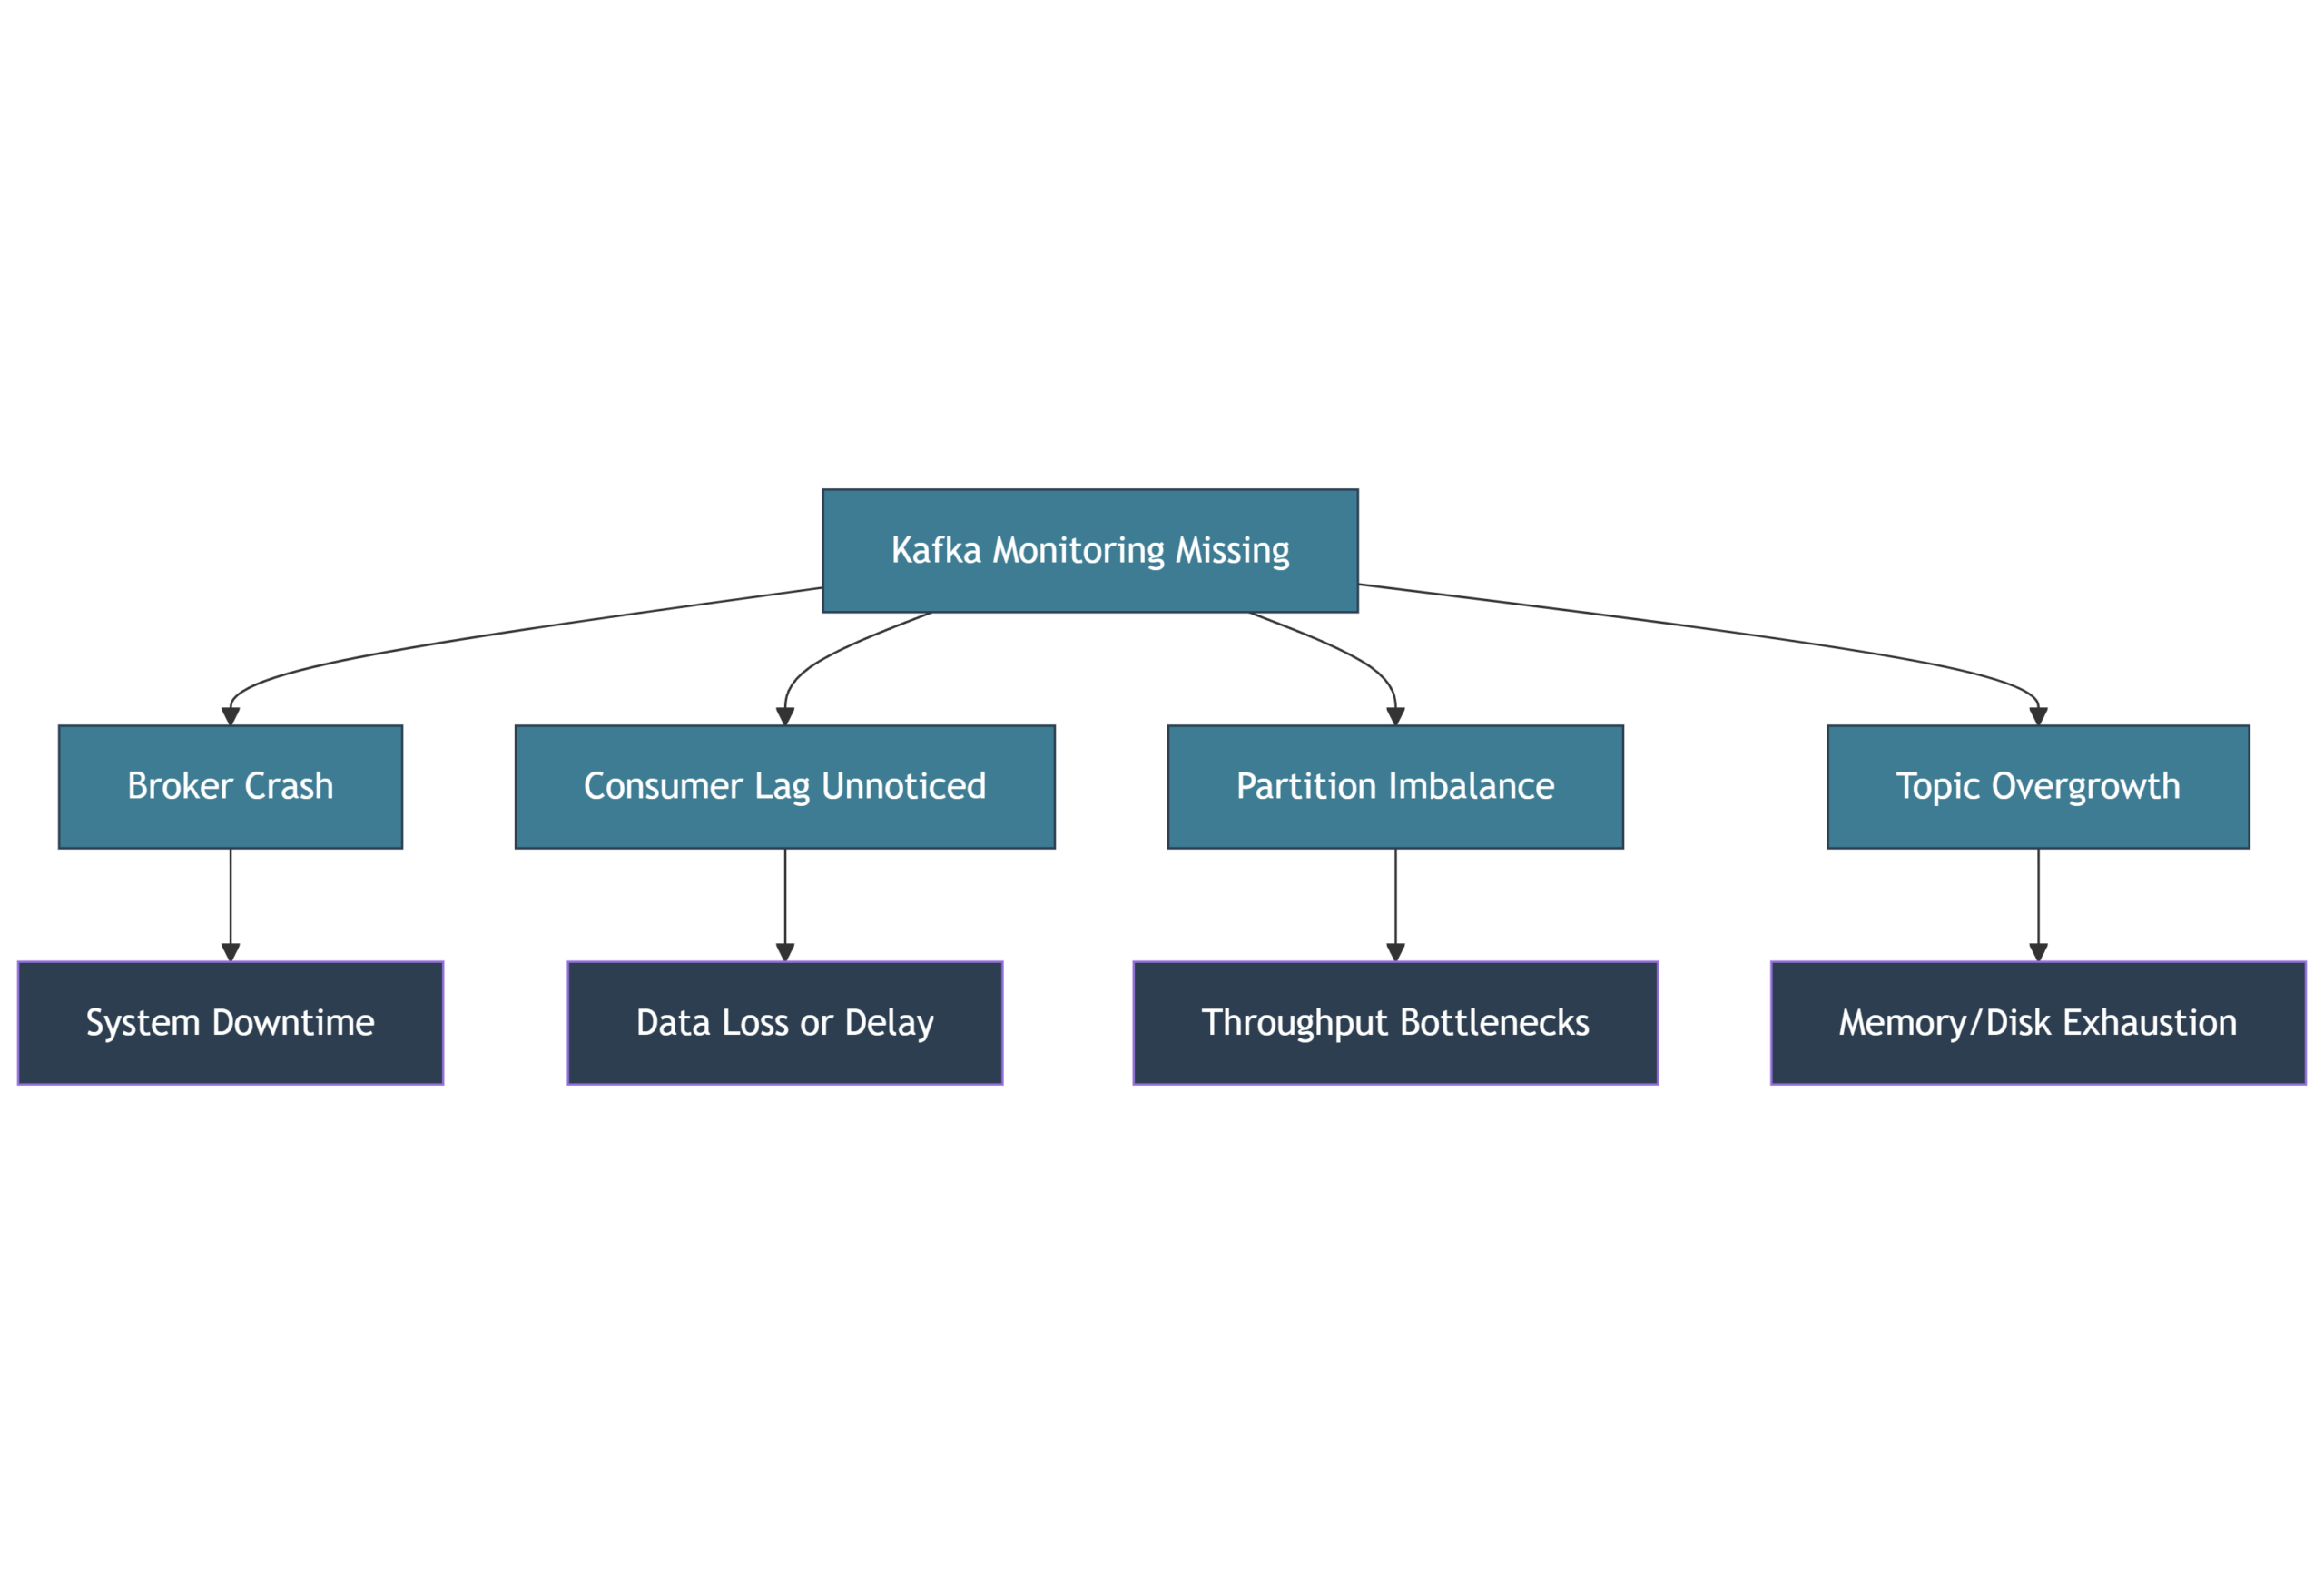
Since Kafka is designed for high-throughput, low-latency message ingestion, it powers a wide range of applications: fraud detection systems, IoT telemetry, streaming analytics, and more. Monitoring Kafka clusters is critical because:
- Kafka brokers can crash or become overloaded.
- Consumer lag may go unnoticed without alerts.
- Partition imbalance affects throughput and availability.
- Kafka topic growth can exhaust disk or memory.
Without real-time monitoring, teams risk data loss, delayed messages, or degraded Kafka system performance.
What tools are available for Managing Kafka?
A variety of tools help manage and monitor Kafka systems. These include:
- Prometheus and Grafana: Collect and visualize Kafka metrics using exporters.
- Redpanda Console: Lightweight UI for Kafka monitoring and debugging.
- Cruise Control: Cluster rebalancer with advanced broker load analytics.
- Confluent Control Center: Enterprise-grade dashboard with built-in lag tracking and stream observability.
- Kafdrop / Kafka UI: Open-source web interfaces for topic and partition management.
These tools help developers, operators, and platform teams manage Kafka clusters effectively, whether deployed on-premises or in the cloud.
Key metrics to monitor in Kafka
Effective Kafka monitoring and management starts with understanding the right metrics to watch:
Kafka broker metrics
- Under-replicated partitions
- Leader elections per second
- CPU usage and memory footprint
Kafka topic & partition metrics
- Messages in/out per second
- Partition count per topic
- Log size per partition
Consumer metrics
- Consumer lag (per consumer group and partition)
- Offset commit rate
- Throughput per consumer group
Kafka system metrics
- Disk usage per broker
- JVM GC time and heap usage
- ZooKeeper latency and session count (if using ZooKeeper-based Kafka)
Top 5 Kafka Monitoring Tools (2025)
1. Prometheus and Grafana
Prometheus is an open-source monitoring solution widely used for collecting metrics from Kafka clusters via the Kafka Exporter or JMX Exporter.
Grafana, the visualization companion, renders rich dashboards with real-time metrics.
Why it’s great:
- Native support for Kubernetes deployments.
- Scalable, open-source monitoring stack.
- Alerting capabilities with Prometheus Alertmanager.
What to monitor:
- Kafka JMX metrics using exporters.
- Kafka broker CPU usage, memory, disk.
- Kafka topic throughput and consumer lag.
Best practices:
- Use pre-built Grafana dashboards for Kafka.
- Integrate alerts for key thresholds (e.g., lag > 5000).
2. Redpanda Console (Kafka Compatible)
Originally built for Redpanda, this open-source console now supports Apache Kafka. It provides an intuitive UI to explore Kafka topics, partitions, schema, and lag.
Why it’s great:
- Lightweight and fast.
- Real-time monitoring of consumer lag.
- Developer-friendly UI.
Use cases:
- Dev environments, debugging partition states.
- Visualizing throughput and consumer progress.
3. Cruise Control
Cruise Control is a self-balancing Kafka cluster management tool. It’s ideal for monitoring Kafka cluster performance and automating rebalancing.
Why it’s great:
- Advanced analytics on broker utilization.
- Automates Kafka rebalancing.
- Visual interface and REST API for actions.
Monitors:
- Broker load, network usage, disk throughput.
- Partition skew, replica distribution.
4. Confluent Control Center
A proprietary Kafka monitoring tool built into Confluent Platform. It delivers comprehensive observability into Kafka metrics with built-in alerts.
Why it’s great:
- Full-stack Kafka observability.
- Lag tracking, schema evolution, connector monitoring.
Limitations:
- Licensing cost.
- Vendor lock-in for some features.
5. Kafdrop / Kafka UI
These are lightweight, open-source web UIs that provide basic visibility into Kafka topics, partitions, and offsets.
Why they’re great:
- Quick to deploy.
- Simple interface for developers.
Ideal for:
- Non-production or low-scale deployments.
- Complementary monitoring to Prometheus.
What is the impact of Kafka on data processing speed?
Kafka offers exceptional performance characteristics that impact data processing speed positively:
- It supports millisecond-level latency (as low as 2 ms).
- Kafka brokers can process millions of messages per second.
- Parallelism via partitions allows scaling throughput horizontally.
To fully benefit, you must monitor metrics like producer throughput, broker disk I/O, and consumer lag. Performance tuning using parameters like compression.type, batch.size, and linger.ms also helps reduce Kafka latency and increase throughput.
Best practices for Kafka monitoring
To ensure your Kafka deployment remains healthy and performant:
- Automate alerts for critical Kafka metrics like consumer lag, under-replicated partitions, or disk saturation.
- Use dashboards that highlight both infrastructure metrics and Kafka-specific ones.
- Tune producers/consumers to balance throughput and latency (e.g., adjust
batch.size,linger.ms). - Monitor Kafka logs for early warnings or rebalance events.
- Integrate third-party monitoring tools only where required — open-source stacks are often sufficient.
Inteca: Kafka monitoring built-in
At Inteca, we deliver fully managed Kafka services with integrated observability:
- Kubernetes-native monitoring using Prometheus and Grafana.
- Out-of-the-box dashboards for Kafka clusters.
- Support for Kafka lag monitoring, alerting, and performance tuning.
- Secure deployments using KafkaUser CRDs, TLS auth, and RBAC.
Whether you’re building an internal developer platform or a regulated financial pipeline, Inteca ensures your Kafka system is observable by design.
Conclusion
Monitoring Kafka clusters is no longer optional. With metrics like consumer lag, broker health, and topic throughput being mission-critical, having the right monitoring tools is vital.
From open-source favorites like Prometheus + Grafana to enterprise tools like Confluent Control Center, there’s a monitoring solution for every need.


